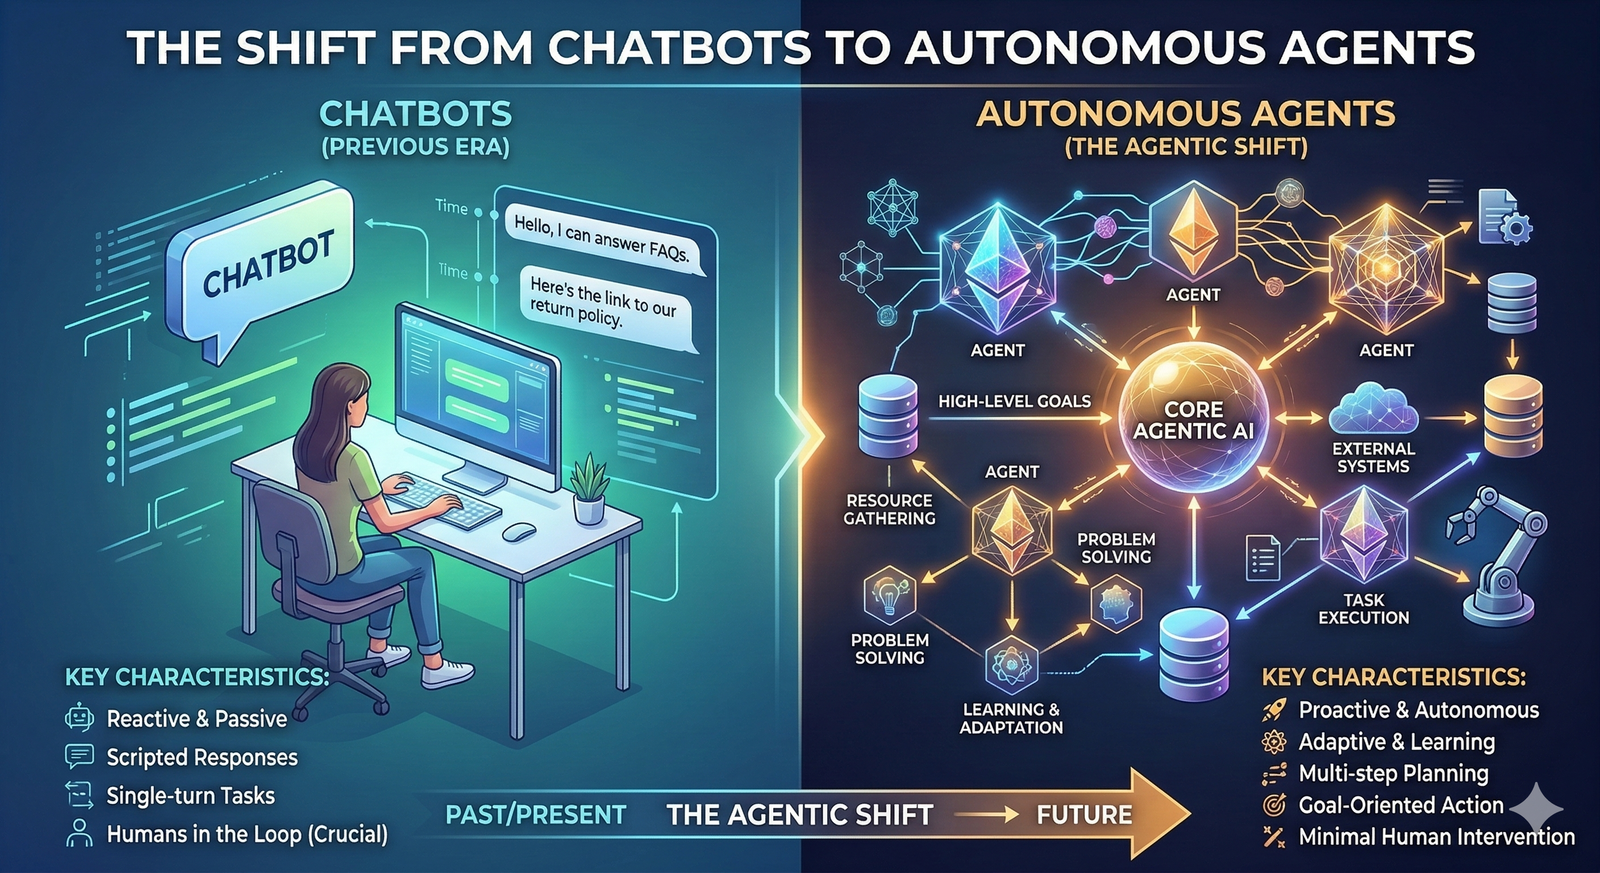
1. The Shift: From "Writing Code" to "Asking Questions"
In 2026, EDA is no longer about remembering the exact syntax for a Matplotlib box plot. It is about Intent-Based Exploration.
Natural Language Queries: Instead of
df.groupby('region')['sales'].sum(), you simply ask, "Which region shows the highest correlation between discount rates and churn?"Context-Aware Reasoning: Modern AI tools (like Claude 4.6 or Gemini 2.0) don't just run the math; they explain the "Why." They can infer that a spike in your data on a specific Tuesday was likely due to a public holiday or a documented system outage.
2. The 2026 AI Data Analysis Stack
The landscape is divided into three types of tools. Choosing the right one depends on your technical depth and the scale of your data.
| Tool Category | Top 2026 Examples | Best For |
| Conversational Agents | Julius AI, Julius, ChatGPT Plus | Quick, ad-hoc EDA and instant visualization. |
| Agentic Notebooks | Deepnote, Zerve, Databricks Assistant | Collaborative data science and production-ready code. |
| Enterprise BI | Power BI Copilot, Tableau Pulse | Executive dashboards and large-scale corporate data. |
3. The 3-Step Master Workflow for AI-Driven EDA
Step 1: Automated Data Hygiene (The Cleanup)
In 2026, AI excels at the "grunt work." Use an agent to:
Infer Schema & Types: Automatically detect if a column should be a category, datetime, or float.
Impute Missing Values: Use LLMs to suggest the most logical way to fill gaps—whether through mean imputation or sophisticated regression—based on the column's context.
Normalize Formats: Instantly fix inconsistent date formats or "Messy" categorical strings (e.g., "Wah Cantt" vs "WahCantt").
Step 2: Hypothesis Generation & "Deep Think"
Don't wait for a spark of inspiration. Use a "Deep Think" model to generate a list of 10 hypotheses to test against your data.
Example: "Given this retail dataset, suggest five non-obvious factors that might be influencing our customer lifetime value."
Step 3: Visual Storytelling (The "Show, Don't Tell")
Move beyond basic bar charts. AI tools now generate Generative UI components on the fly.
Dynamic Visualization: Ask the AI to build a Decomposition Tree or a Heatmap to show geographic sales density in Pakistan.
Narrative Summaries: Use AI to draft the "Executive Summary" that accompanies your charts, highlighting the three most statistically significant findings.
4. Avoiding the "Hallucination" Trap
The greatest risk in 2026 EDA is Automated Misinterpretation. To stay accurate:
The "Show Your Work" Rule: Only trust tools that provide the underlying Python or SQL code. Always verify the logic behind a calculated field.
Confidence Thresholds: Look for tools that provide Uncertainty Scores. If the AI is only 60% sure about a correlation, you need to dig deeper manually.
The "Human-in-the-Loop" Audit: Use AI to do the heavy lifting, but use your domain expertise (e.g., your knowledge of the local Wah Cantt market) to validate if the results "make sense."
5. 2026 SEO Strategy: Ranking for Data-Driven Insights
In 2026, search engines prioritize Verified Data Entities.
Citation-Rich Content: When publishing your EDA findings, use Schema.org/Dataset and link to your raw (anonymized) sources.
Interactive Data Stories: Search agents favor pages where users can "interact" with the data—think embedded AI chat windows that let users ask their own questions about your report.
Summary: The Rise of the "Strategic Architect"
Mastering EDA in 2026 isn't about being a better programmer; it's about being a better thinker. By offloading the mechanical work of data cleaning and plotting to AI, you are liberated to focus on the high-level strategy that turns raw numbers into business growth.